What Are Dietary Reference Values (DRVs)?
Last Updated : 01 December 2013Dietary Reference Values (DRVs) are important for supporting public health, developing labelling laws and identifying populations at risk of over- or under-consumption. However, the process of developing them is complex, and they should not be viewed as recommendations or goals for individuals. Rather, they require interpretation by professionals and can form the basis of dietary advice.
Deriving DRVs
DRVs are quantitative reference values for nutritional intakes derived for different population groups, based on health criteria. They guide professionals on the estimated quantities of energy and nutrients needed to support adequate growth, development and health, while reducing the risk of deficiencies and non-communicable diseases such as heart disease or cancer.1
In defining nutrient adequacy, a range of criteria is considered. For most nutrients a hierarchy can be established – ranging from prevention of clinical deficiency to optimisation of body stores, or status. Depending on the criteria selected, a variety of information sources can be used: in vitro studies, animal studies, human experimental trials, and epidemiological surveys. Several factors are taken into account; these include age, gender, specific needs during pregnancy and lactation, the influence of environmental stress such as infection, and bioavailability (proportion of a nutrient absorbed and used by the body). Hence, DRVs are developed for different life-stages and gender groups, and for different age ranges, depending on the available data. Within any population group, nutrient requirements vary between individuals.1
European DRVs
The European Food Safety Authority (EFSA) published updated DRVs for fats, carbohydrates (including sugars and fibre), and water in 2010, protein in 2012, energy in 2013, while those for micronutrients are in progress.1-3 EFSA also produced guiding principles for deriving and applying DRVs, which include acceptable types of studies, methods for determining (and factors influencing) nutrient requirements, and how diet influences chronic disease risks.1 The EU project EURRECA (EURopean micronutrient RECommendations Aligned) has developed a framework for deriving and applying DRVs for micronutrients.4
Which type of DRV is set, and the criteria used, is decided on a case-by-case basis for each nutrient. Within a population group for which DRVs are derived, there remain variations between individuals and hence there is a distribution of requirements in the population. A wide range of terminologies has been used by different national agencies. In Europe, terminology has been harmonised and EFSA used the following set of defined DRVs.
- Population Reference Intake: level of intake adequate for virtually all people, i.e. an optimal intake for the population as a whole.
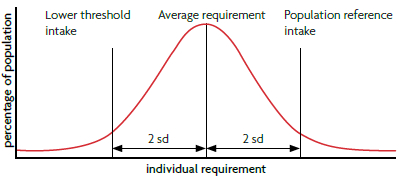
- Average Requirement: level of intake adequate for half of the people, assuming a normal distribution of requirements (see Figure 1).
- Lower Threshold Intake: level of intake below which, on the basis of current knowledge, almost all individuals would have an inadequate intake.
- Adequate Intake (when evidence is insufficient to set a Population Reference Intake): the average level of a nutrient consumed by healthy populations (i.e. assumed to be adequate).

Figure 1. Distribution of requirements of a population group assuming that the requirement is normally distributed and the variation in requirements between individuals is known. The Population Reference Intake is two standard deviations (SD) above the Average Requirement, and the Lower Threshold Intake is two SD below the Average Requirement.1
Since DRVs not only aim to ensure sufficient intakes of essential nutrients, but also guard against over-consumption, the following reference values also exist:
- Reference intake ranges for macronutrients: expressed as a proportion of daily energy intakes, to reflect intakes that are adequate for maintaining health and are associated with a low risk of chronic disease. For example, the reference intake range set for dietary fat is 20–35% of total daily energy intake.1
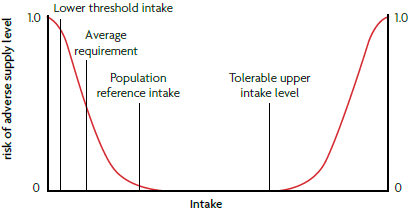
- Tolerable Upper Intake Level (or Upper Level): the maximum level of chronic daily intake of nutrients unlikely to have adverse health effects (see Figure 2).

Figure 2. Relationship between individual intake and risk of adverse effects due to insufficient or excessive intake.1
Applying DRVs
DRVs can be used in policy making, healthcare, the food industry, and academic research. They can be used for dietary assessment, planning diets, and developing dietary recommendations for individuals or groups, and for food labelling.
Dietary assessment and planning
Dietary intakes can be estimated and assessed against DRVs to determine whether diets are at risk of inadequate, or indeed excessive, intakes of nutrients. Dietary assessment should take into account day-to-day variations in intake and likely under-reporting of food (and nutrients) to accurately reflect habitual intakes. Dietary planning aims to determine diets that have a low probability of nutrient inadequacy or excess.1
Individuals with habitual intakes which fall below the Average Requirement are likely to have inadequate diets, and those with intakes below the Lower Threshold Intake have diets that are very probably inadequate. In contrast, chronic intakes above the Upper Level may be associated with an increased risk of adverse effects. However, there are inherent problems with assessing the usual dietary intakes of individuals due to the limitations in methods such as food diaries and questionnaires. A valid assessment of an individual’s diet should take into account individual variations in nutrient requirements, using anthropometric, biochemical (status) and clinical data, and physical activity levels.1
In groups of people, the distribution of nutrient intakes among the population is considered more important than a fixed recommended intake level. Dietary intakes of groups are obtained from food consumption surveys. The percentage of people with intakes below an Average Requirement (AR cut-point method) is the estimated proportion of a group likely to have inadequate intakes. This method is appropriate if the distribution of nutrient intakes is normal (as exemplified by the bell-shaped curve in Figure 1). Iron is an example of a nutrient showing a skewed distribution of individual requirements within a population; the cut-point method would underestimate the prevalence of inadequate intakes of iron in menstruating women.1
Alternatively, statistical methods exist (e.g. the probability approach or Monte Carlo simulation) which take into account the variability of intakes and requirements. The Population Reference Intake should not be used as a cut-point, as this would overestimate the proportion of people at risk of inadequate intakes. A mean intake at or above an Adequate Intake implies a low prevalence of inadequate intakes. If an individual’s intake falls below the Adequate Intake, however, the probability of nutrient inadequacy cannot be estimated.1
In dietary planning for individuals or groups, the Population Reference Intake (or Adequate Intake) can be used as a goal for adequate intakes of vitamins, minerals or protein. Median intakes of a group may be higher than the Population Reference Intake (particularly if the intake distribution is skewed).1
The DRVs for energy are given as Average Requirements of specified age and sex groups. Since energy requirements vary widely, DRVs are of limited use for individuals. The appropriate Average Requirement for energy (based on sex, age, height, weight and physical activity level) may be used as a planning goal, but will exceed the needs of half the individuals of a defined group. This may result in a positive energy balance for these individuals, which in the long-term would increase body weight. Body weight history is a useful indicator of whether usual intake has matched energy needs, and body weight should be monitored and intake adjusted as appropriate.1
Dietary goals and recommendations
Dietary goals and recommendations consider health needs, nutritional status and consumption patterns, and the composition of available foods. Targets for nutrient intakes at population level may be set for public health planning and assessment. An example of a nutrient goal might be a population average fat intake of 30% energy, i.e. relative to mean total daily energy intake, 30% of the energy comes from fat. Nutrient recommendations are typically targets for the nutrient intakes of individuals, for example ≤10% energy for saturated fatty acids. These may not always be communicated directly to the consumer, but rather are for use by healthcare professionals and policymakers. EFSA has published guidance on how DRVs could be used to create food-based dietary guidelines (FBDGs), which are more easily understood by consumers than numerical targets.5 At national level, recommendations consider the dietary habits and needs of diverse groups. Twenty-five Member States are already using FBDGs, the most common types being food plates, pyramids or circles.6
Food labelling
DRVs also form the basis of nutrition labelling on foods, beverages and dietary supplements. The new regulation on food information to consumers makes it mandatory that food labels provide information on energy, total fat, saturated fat, carbohydrate, sugars, protein and salt per 100 g, or 100 ml if a liquid. Per portion information may also be given. In addition to absolute values, nutritional content may be expressed as a percentage of the reference intake (RI) of an average adult (commonly known as Guideline Daily Amounts, GDAs), in relation to per 100 g/ml or a typical portion size. These RIs are consistent with dietary advice for the general population and have been set for labelling purposes, based on a 2000 kcal (8400 kJ) diet: 70 g fat (31.5% energy), 20 g saturated fat (9% energy), 260 g carbohydrate (52% energy), 90 g sugars (18% energy), 50 g protein and 6 g salt.7,8 For example, the nutrition label on a yoghurt may state 2.8 g fat per 100 g, 4% of the RI. On food labels this information will be accompanied by the phrase “Reference intake of an average adult (8400 kJ/2000 kcal)”.
In addition, vitamins and minerals may be labelled if present in significant amounts, in which case their content must also be expressed as a percentage of reference values.8 EFSA have not yet published updated DRVs for micronutrients, but these have been set for labelling purposes.
DRV misapplication
DRVs can be used inappropriately. For example, it does not make sense to criticise individual foods or beverages because they fail to meet DRVs for fat, salt or sugars. Actually DRVs are expressed on a daily basis, and are applied to the whole diet, over longer periods of time.
Furthermore, reference values should not be misinterpreted as nutritional advice to individuals. DRVs act as points of reference for professionals, who use DRVs when developing policy and recommendations to consumers. They are estimates (not exact values), and are intended for healthy people; they cannot be applied to patients without caution.1 The role of health professionals, particularly dietitians, is important for tailoring DRVs to individual needs.
Consumers should aim to follow FBDG in the long term through a balanced and varied diet. Reference intakes on food labels are not targets. Percentages of reference intakes aim to help consumers to estimate the relative contribution of individual products to daily dietary intake, and provide one way of comparing the nutritional content of products.
Further information
EURRECA website: www.eurreca.org
References
- EFSA (2010). Scientific Opinion on principles for deriving and applying Dietary Reference Values. EFSA Journal 8(3):1458. https://efsa.onlinelibrary.wiley.com/doi/abs/10.2903/j.efsa.2010.1458
- EFSA (2013). Scientific Opinion on Dietary Reference Values for energy. EFSA Journal 11(1):3005. https://efsa.onlinelibrary.wiley.com/doi/abs/10.2903/j.efsa.2013.3005
- EU project EURRECA, www.eurreca.org
- EFSA (2010). Scientific Opinion on establishing Food-Based Dietary Guidelines. EFSA Journal 8(3):1460. http://www.efsa.europa.eu/en/efsajournal/doc/1460.pdf
- EFSA (2009). Scientific Opinion of the Panel on Dietetic Products, Nutrition and Allergies on a request from the Commission related to the review of labelling reference intake values for selected nutritional elements. EFSA Journal 1008:1-14. http://www.efsa.europa.eu/en/efsajournal/doc/1008.pdf
- Regulation (EU) No 1169/2011 of the European Parliament and of the Council of 25 October 2011 on the provision of food information to consumers: http://eur-lex.europa.eu/LexUriServ/LexUriServ.do?uri=OJ:L:2011:304:0018:0063:EN:PDF